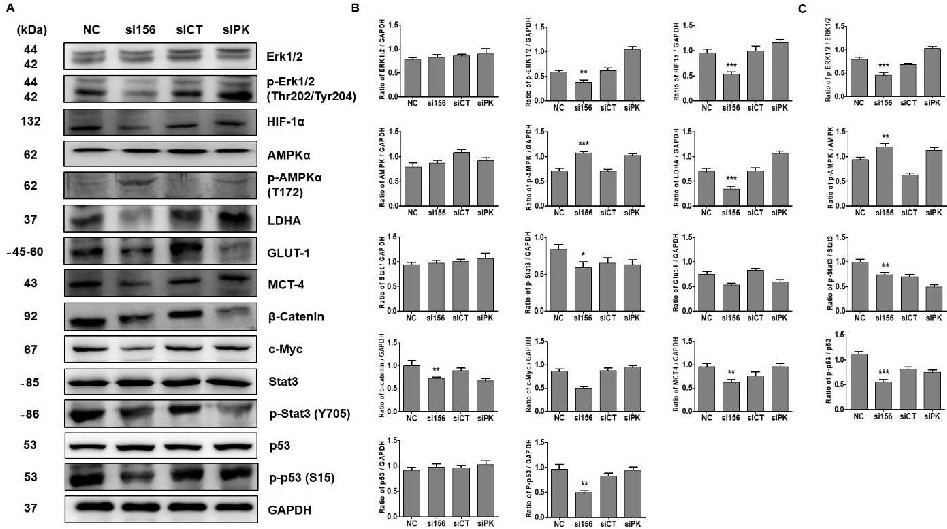
Fig. 5. (A) Effect of PKM2 knockdown on the expression levels of different glycolytic signaling proteins. DU145 cells were transfected with the indicated siRNAs (100 nM for 72 h), and western blotting was performed to determine the expression levels of the glycolytic proteins. Representative blots are shown. (B) The intensities of the bands were measured and depicted in the bar graph by the ratio of GAPDH. (C) The ratio of p-ERK1/2/ ERK1/2, p-AMPK/AMPK, p-Stat3/Stat3 and p-p53/ p53 were measured and depicted in the bar graph. One-way ANOVA was used to compare the means of different groups. Differences between the means were considered to be significant at P<0.05 by using Tukey multiple comparison tests; *P<0.05, **P<0.01, and ***P<0.001 compared with the normal control cells.